- Sales & Support
- +61 2 4225 9698
- [email protected]

Keys to Creating a Successful Classroom in 2021
February 9, 2021
Using Intrinsic & Extrinsic Motivation to Motivate Students.
April 9, 2021Variables in the Science Classroom

By: Anita McMahon
As a Renaissance Coach, I work with literacy and numeracy … a lot! In my professional development sessions, I work with teachers from all subject areas and in my own experiences, teaching Secondary Science, I found that even in the most scientific of concepts, we are able to highlight and develop student literacy skills. One such example is the knowledge and use of variables.
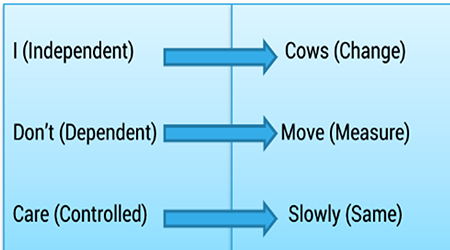
I was in Year 9 when I first came to really understand variables. It was during a science class when my teacher said, “I don’t care, cows move slowly”. This mnemonic has since helped me remember variables when conducting experiments throughout high school and even university. If I’m completely honest, I have also referred to it whilst teaching and may have even claimed it as my own. Before I explain, let’s explore variables!
What are variables?
Variables are factors that can either be controlled or changed[1]. In mathematics, variables such as ‘x’ and ‘y’ are best understood as placeholders for a numerical value until the equation is solved.[2] In science however, variables are more complicated. They are associated with the scientific method and play an important part in ensuring that a scientific experiment is valid. There are 3 types of variables – independent, dependent and controlled (or constant).
Independent Variable
This is the variable that is changed in the experiment. For an experiment to be fair, there should be only one independent variable. For example, if you were conducting an experiment to determine what type of liquid would reach boiling point the quickest using water, alcohol, milk, or honey – the independent variable would be the type of liquid, because that is what’s being changed. When graphing data, the independent variable is always drawn on the ‘x’ axis.
Dependent Variable
The dependent variable is the one that is measured and is affected by the independent variable. In the boiling liquid experiment mentioned above, the dependent variable would be the time it takes for each liquid to boil. This is because time is being measured. When graphing data, the dependent variable is always drawn on the ‘y’ axis.
Controlled (or Constant) Variables
All the other variables that are kept the same throughout the experiment are referred to as controlled or constant variables. This is to ensure that only one variable is being tested and the experiment is valid. There are multiple variables that are kept the same in the example experiment above such as the amount of liquid used and the starting temperature of the liquid. Controlled variables are not shown when graphing data.
–
Where does “I Don’t Care, Cows Move Slowly” fit?
- The ‘I’ represents independent and goes with the ‘C’ which is change – i.e. the independent variable is the one that is changed.
- ‘D’ represents dependent and coincides with “M” for measure – i.e. the dependent variable is the one that is measured.
- Finally, ‘C’ represents control and goes with ‘S’ for same – i.e. the controlled or constant variables are the ones that stay the same.

Why not get your students to come up with their own version? Strengthening literacy and having students ‘re-present’ information they have learnt will aid with memory retention and comprehension.
Want to know more about variables?
Here are some recommended Renaissance Accelerated Reader Books that can further assist your students’ understanding of variables and the scientific method:
- Frankenstein’s Monster and Scientific Methods
Harbo, Christopher L. | ATOS Book Level: 5.2 - Investigating the Scientific Method with Max Axiom, Super Scientist
Lemke, Donald B. | ATOS Book Level: 5.7 - Mad Margaret Experiments with the Scientific Method
Braun, Eric | ATOS Book Level: 2.8 - All About Earth: Exploring the Planet with Science Projects
Latta, Sara L. | ATOS Book Level: 5.0 - Dynamic Planet: Exploring Changes on Earth with Science Projects
Enz, Tammy | ATOS Book Level: 5.0 - Liquid Planet: Exploring Water on Earth with Science Projects
Enz, Tammy | ATOB Book Level: 5.0 - Living Earth: Exploring Life on Earth with Science Projects
Garbe, Suzanne | ATOS Book Level: 5.0
Let us know what other ways you are using literacy and numeracy activities in the Science classroom! Share with others by commenting on our social media platforms!
Referencing:
[2] https://www.researchgate.net/publication/220987563_Variables_in_Mathematics_Education


